SustainabilitySocial
Social Action Program
Happiness
“Happiness” is a project that was launched to “make people happy through fashion”. Activities include donations of our company’s products and holding workshops by our volunteers at orphanages, all aiming to make a contribution to the local community and to educate our employees for a spiritually rich society.

Initiatives for health management
Health Management Declaration
We recognize that maintaining and improving the health of all executives and employees, creating a rewarding workplace environment, and achieving a work-life balance are essential issues in our sustainability management efforts.
In order to realize our management philosophy—namely, “Our goal is to achieve a spiritually nourished society by creating an interesting company with great dreams”—we will actively promote health management so that each and every one of our employees can maintain and improve both their physical and mental health and increase their engagement within the company.
Kazuo Taki
Representative Director, Chief Executive Officer
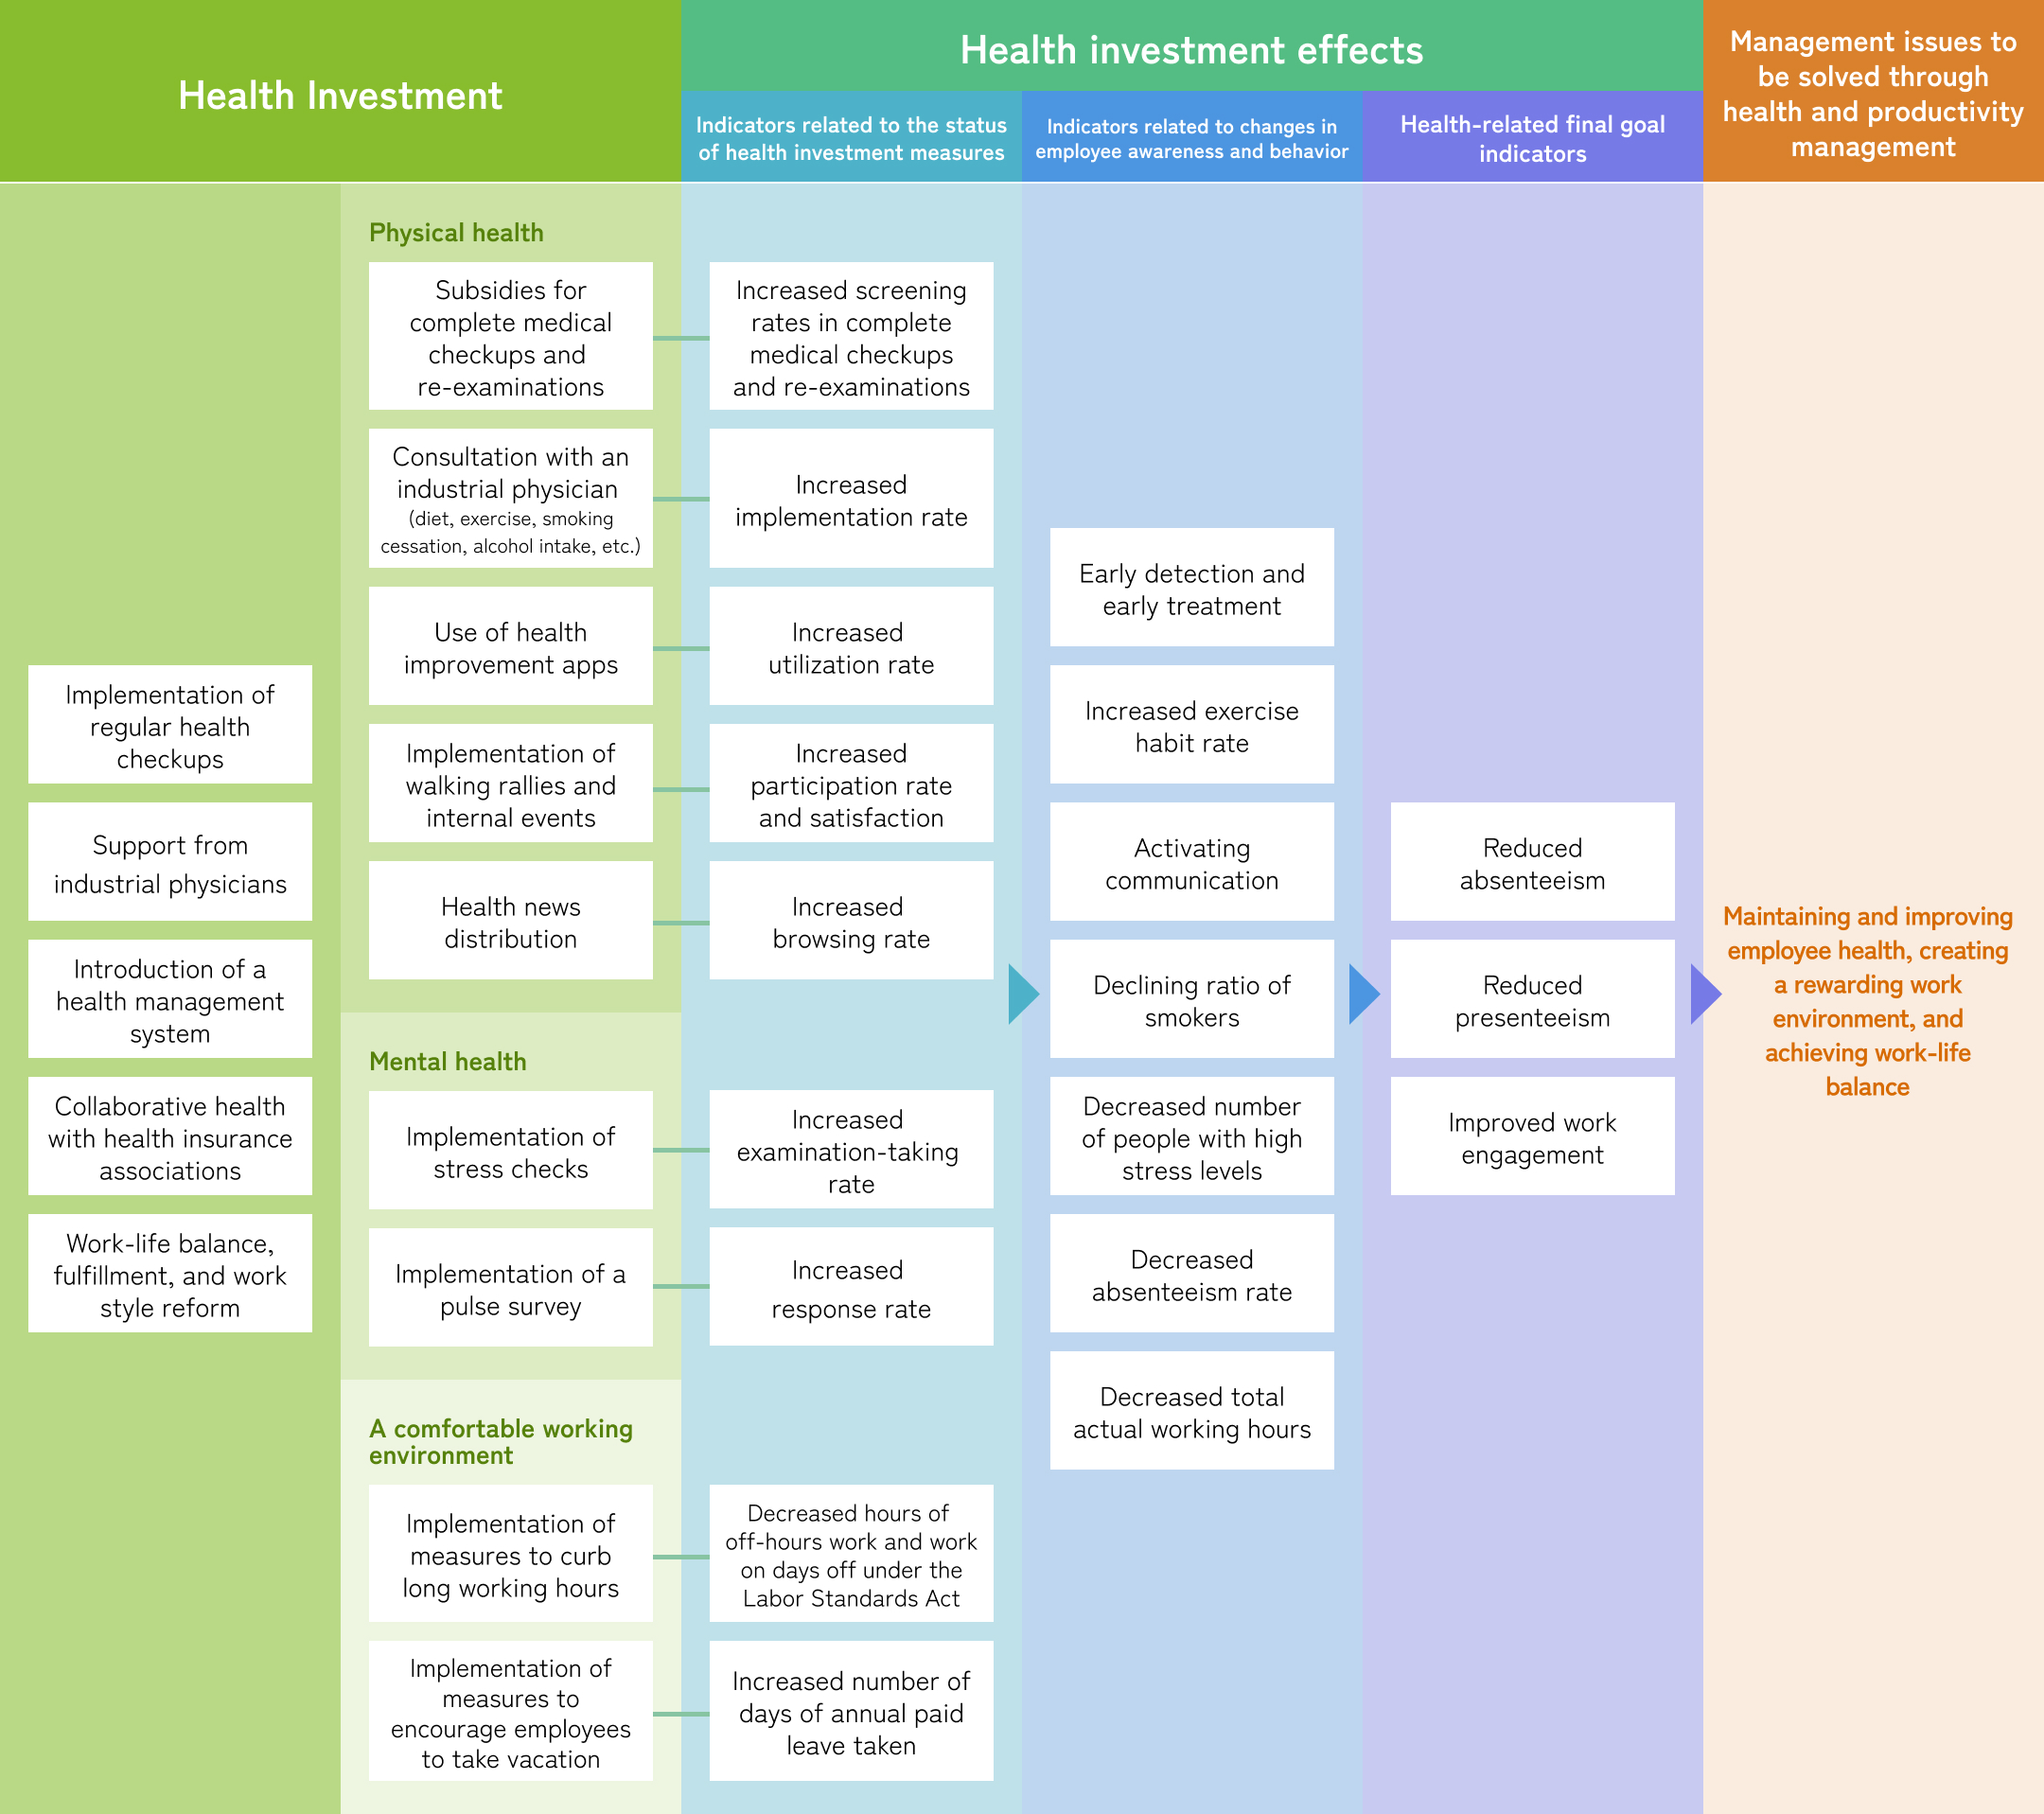
Health and Productivity Management Strategy Map
We will promote health and productivity management by understanding the management issues we want to solve through health and productivity management, the expected effects, and the connection between specific health promotion activities.
Organization Chart

Numerical Indicators
| FY2025 Target | FY2024 | FY2023 | |
|---|---|---|---|
| Regular health checkup attendance rate | 100.0% | 100.0% | 100.0% |
| Detailed examination attendance rate | 50% | 34.6% | 31.2% |
| Specific health checkup implementation rate | 100.0% | – | 96.6% |
| Specific health guidance implementation rate | 50% | – | 41.7% |
| Smoking rate | 15% | 20.2% | 26.1%(40 years old and older) |
| Percentage of people with drinking habits | – | 14.4% | 29.3%(40 years old and older) |
| Percentage of people who do not exercise regularly | – | 83.7% | 79.6%(40 years old and older) |
| Percentage of obese people | – | 14.7% | 17.8%(40 years old and older) |
| Percentage of people with high blood sugar levels(not visiting the hospital) | – | 1.1% | 13.4%(40 years old and older) |
| Percentage of people with high blood pressure (not visiting a hospital) | – | 5.7% | 7.3%(40 years old and older) |
| Percentage of people with high lipid levels(not visiting the hospital) | – | 17.8% | 26.8%(40 years old and older) |
| Stress check implementation rate | 100% | 64.4% | 62.8% |
| Percentage of people with high stress | – | 15.0% | 10.2% |
| Paid leave utilization rate | – | 65.9% | 75.0% |
| Total working hours (monthly average per person) | – | 148 hours | 153 hours |
| People on leave (for three months or more) | – | 5 people | 8 people |
| Health app registration rate | 50% | 32.3% | 23.1% |
| Number of walking rallies held | – | 5 times | 4 times |
| Walking rally participation rate | 50% | 32.2% | 12.1% |
Health Issues and Measures
| Health Issues | Measures to Take |
|---|---|
| Promoting physical health |
|
| Promoting mental health |
|
| Creating comfortable workplace environments |
|